Risk Index Map
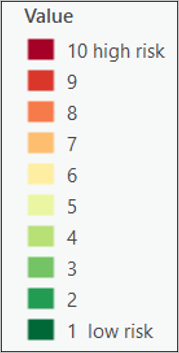
*Note: This image represents the risk index scale (Low to High). Remarque: Cette image représente l’échelle de l’indice de risque (faible à élevé).
Methodology and Results
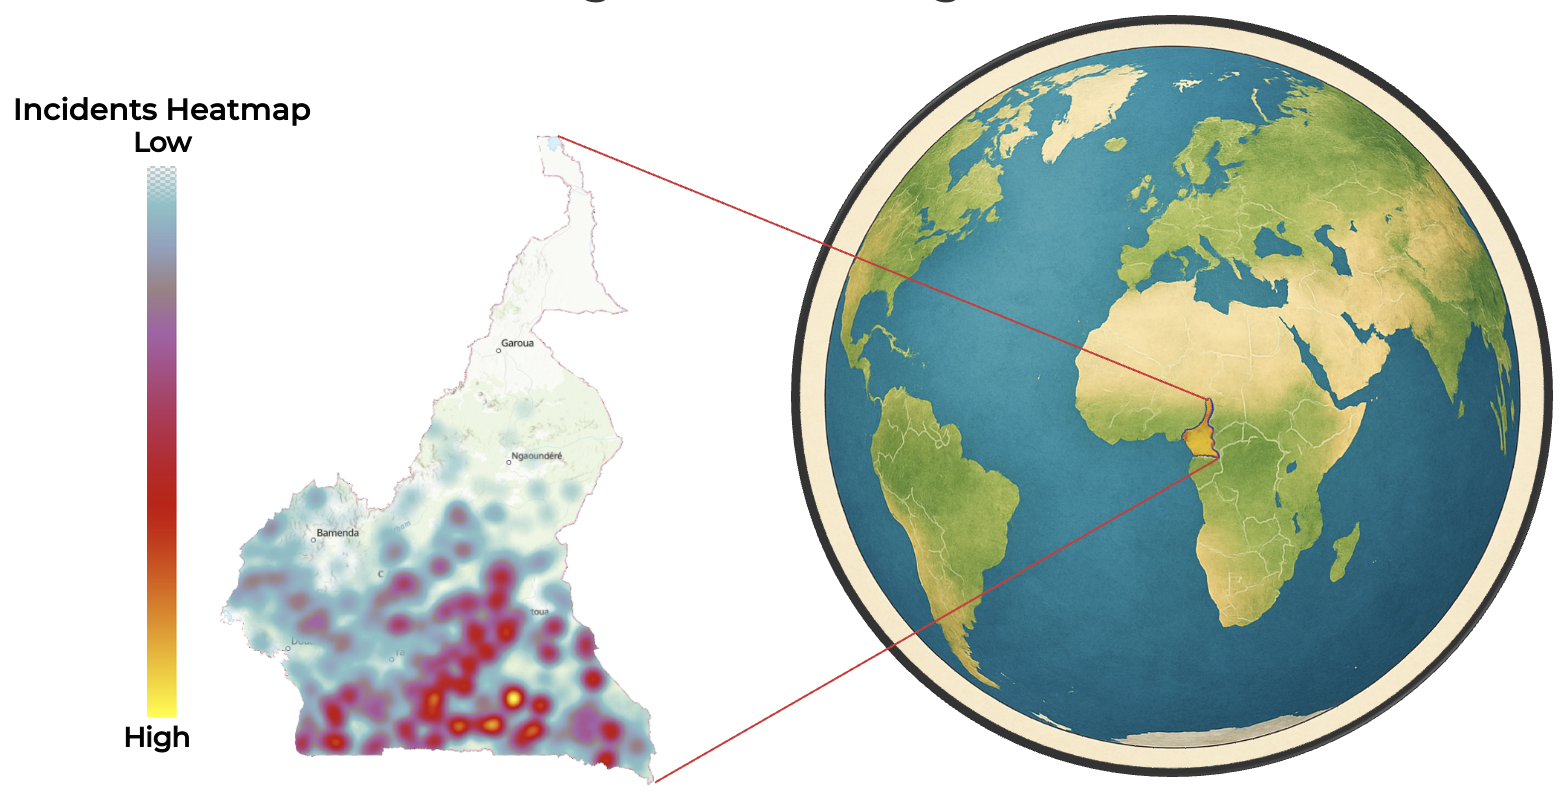
A Heatmap shows where pangolins are killed.
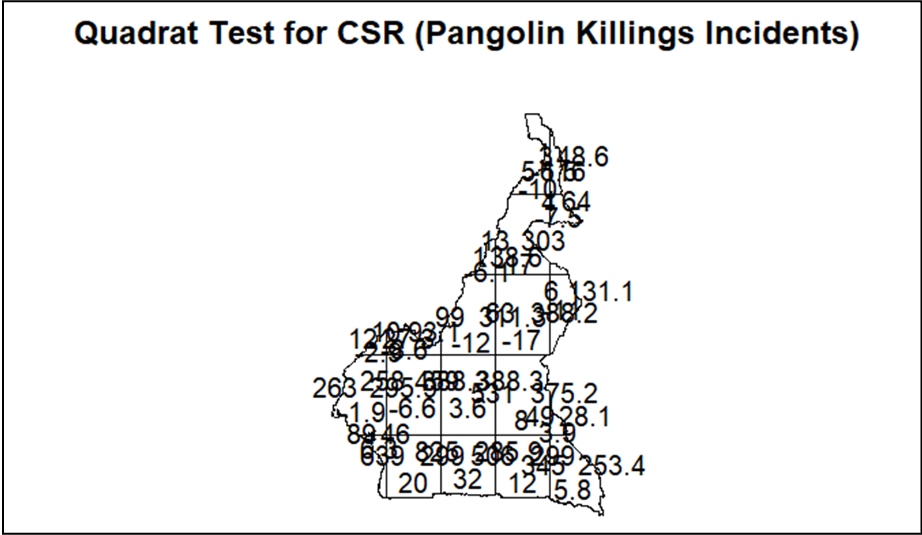
Spatial analysis shows that pangolin poaching in Cameroon is strongly clustered, with the Quadrat Test.
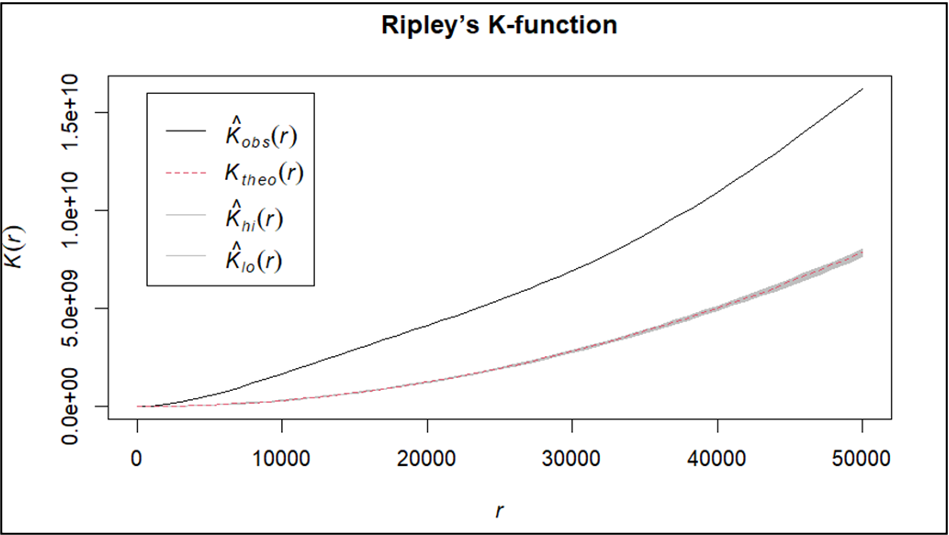
Ripley’s K confirming significant aggregation across 5–50 km.
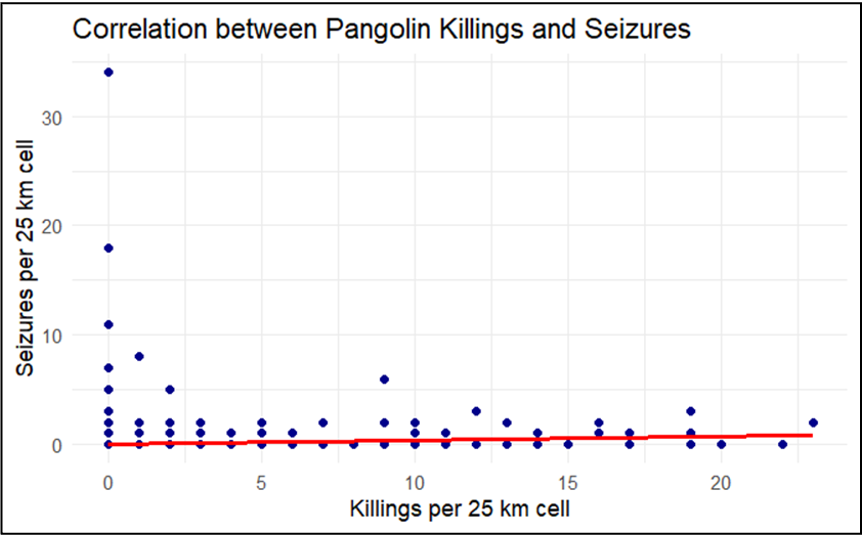
Correlation between killings and seizures.
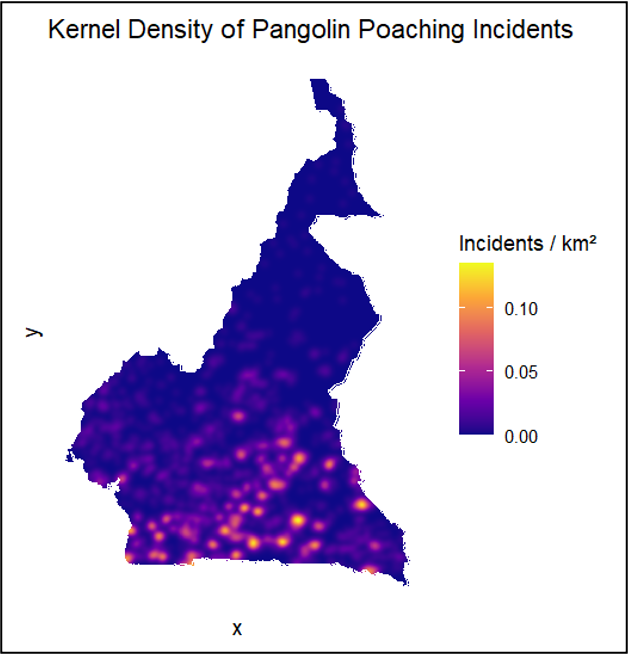
Density of pangolin poaching incidents.
Spatial analysis shows that pangolin poaching in Cameroon is strongly clustered, with the Quadrat Test (χ² = 2899.2, p smaller than 0.001) and Ripley’s K confirming significant aggregation across 5–50 km. Killings and Seizures show a weak but significant positive correlation (r = 0.10), indicating that trafficking pressure is uneven and concentrated in a small number of high‑activity zones. The Composite Risk Surface highlights areas where accessibility, forest cover, and known trafficking points converge, identifying the Southern and Central forest regions as priority hotspots for Operation Pangolin’s targeted surveillance and intervention.
Expected Impact and Conclusion
- Strengthens evidence-based anti-trafficking enforcement
- Enables targeted patrols and optimized resource allocation
- Improves community engagement and reporting accuracy
- Creates a transferable workflow for other wildlife-trafficking contexts
- Supports Operation Pangolin’s scientific pillars: ecological monitoring, big data, policy, and conservation criminology
Conclusion
By integrating GEOINT, Community Knowledge, and Spatial Analytics, Operation Pangolin demonstrates a replicable model for leveraging geospatial data to protect pangolins, one of the most threatened mammals on Earth.